Buy Gun Stocks? Vote for Trump.
How Robinhood trading data can predict elections
In 2016, everyone from political experts to a psychic monkey attempted to predict whether the White House would go red or blue. As results were counted, many realized just how wrong most of those predictions and polls were, which got our wheels turning. Could trading patterns predict the winning candidate based on which symbols were traded prior to the election? Our data team set out to find the answer.
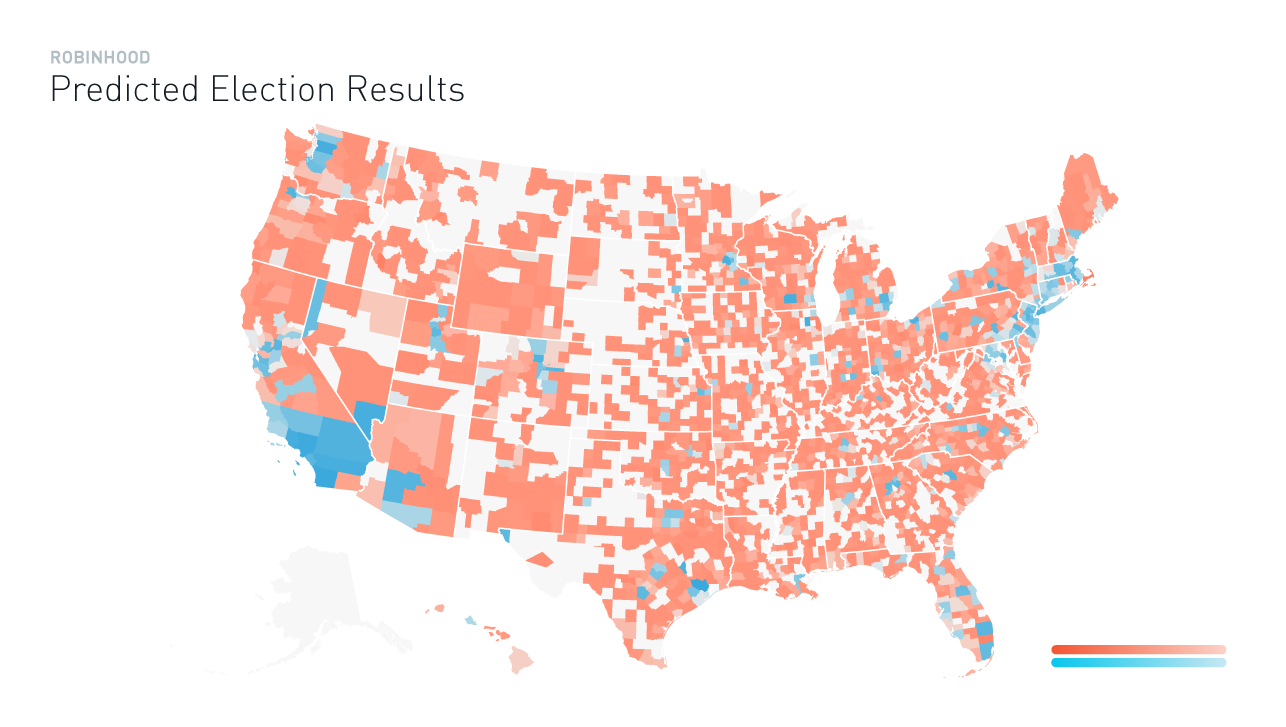
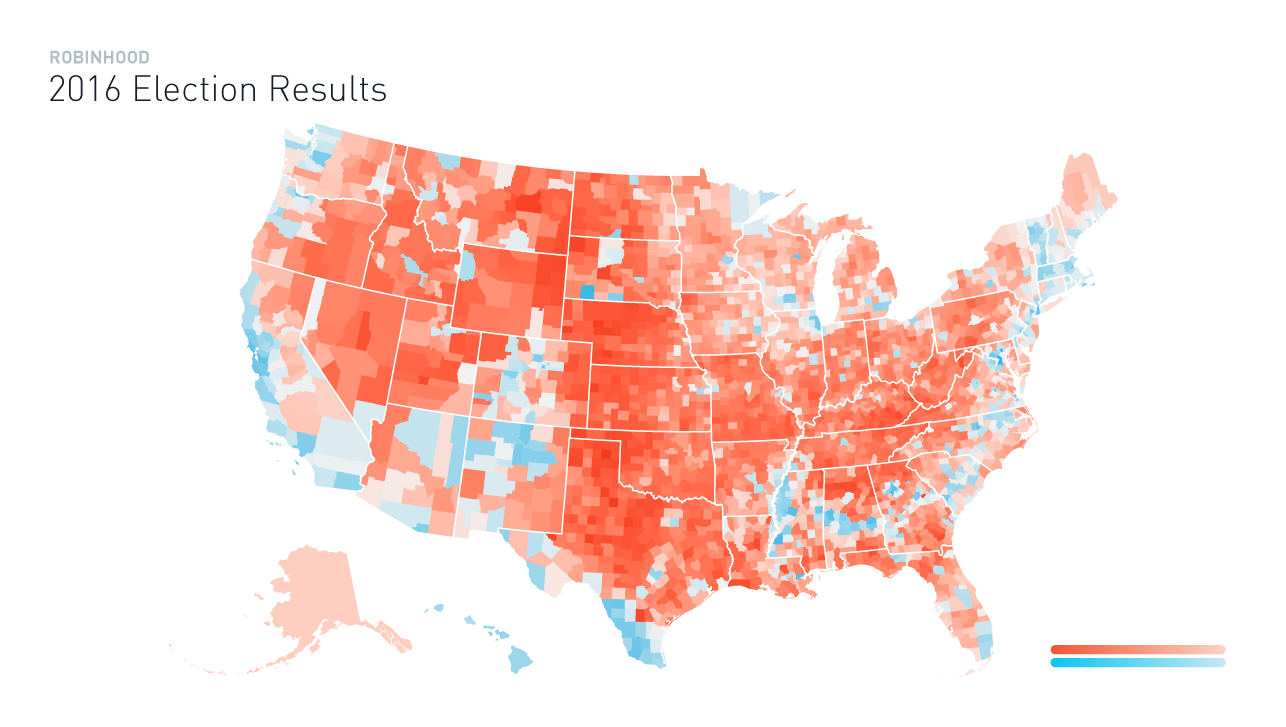
Fortunately, there are one million Robinhood investors spread around the country – with users in all 50 states – and as it turns out, Robinhood investors from 70% of all U.S. counties placed trades in the week prior to the election. This massive dataset provided us with an answer. We determined that pre-election trading patterns in a given county could accurately predict whether they went blue or red 86.3% of the time. (See map above).
Not to brag, but that’s a better success rate than Nate Silver.
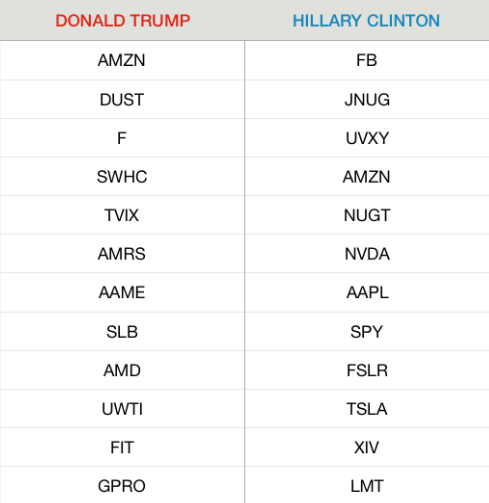
By looking at the top 12 stocks bought in red and blue counties, we started to see some interesting patterns:
Portfolios are partisan
Looking closer at which stocks were bought and sold, it’s clear Americans invest based on their own political views. For example, Republican counties were far more likely to purchase Smith and Wesson stock than Democratic counties, a nod to traditional party-line positions around gun control.
Investors listened to their candidate
Throughout his campaign, Donald Trump promised to bring manufacturing jobs back to the U.S, potentially uplifting Detroit’s automobile industry and hurting technology companies such as Apple, which primarily manufactures its products overseas. Hopeful Trump supporters invested in Ford while Clinton supporters were far more likely to invest in Apple. Clinton’s supporters also invested in green energy stocks such as Tesla and First Solar.
Republicans were pessimistic, Democrats were optimistic
In investigating the data, we saw evidence of how voters really felt about how the economy and stock market would play out under their preferred candidates’ policies. Democrats were betting on the market, buying Standard & Poor (SPY) believing its prices would rise in the future. In contrast, Trump voters anticipated a decrease in prices, shorting the market with Daily Gold Miners Bear as the second-most traded stock.
The below map references the actual election results from 2016 as compared to the prediction from Robinhood user behavior. Head over to our Engineering Blog for insight into our methodology. Check the chart at the bottom to see the top stocks in red and blue counties in the week leading up to the election.
Disclosure: Data was anonymized and aggregated at the county level.
Tweet us — Like us — Join the team — Get help